Direct answer (AEO): Infrared thermography is a predictive maintenance technique that uses a calibrated thermal camera to detect abnormal temperature patterns without contacting the equipment. In electrical systems it reveals loose connections, corroded terminals, overloaded circuits, and unbalanced phases; in mechanical systems it exposes bearing overheating, coupling misalignment, lubrication starvation, and refractory or insulation defects. For a predictive maintenance Indonesia program, thermography is uniquely valuable because it inspects live equipment under load — the condition in which most failures actually develop — and it does so from a safe distance, with no shutdown required and no production interruption. For the wider context, read our guide to predictive maintenance in Indonesia.
Need a thermography partner in Indonesia? Contact Tiaravib — email info@tiaravib.com or WhatsApp +62 821-1378-3727.
At a Glance
- What it is: non-contact measurement of infrared radiation to produce a temperature map of equipment in service.
- Two core applications: electrical inspection (connections, busbars, switchgear, motors, cable terminations) and mechanical inspection (bearings, couplings, gearboxes, insulation, refractory).
- Key advantage: inspects equipment live and under normal load — the condition in which electrical faults actually reveal themselves.
- Key limitation: surface temperature only. It cannot see inside a component, so it complements rather than replaces vibration and oil analysis.
- Recommended interval: annually as a baseline for all electrical distribution, with critical switchgear and high-current joints surveyed more frequently.
Why Thermography Earns a Place in a Predictive Maintenance Indonesia Program
Every predictive technique has a domain in which it is the best available tool, and for electrical distribution that domain belongs to infrared thermography. Resistance in a connection produces heat, and heat is directly proportional to the power dissipated in that resistance. A terminal that has loosened, a busbar joint that has corroded, a contactor whose tip has pitted — all of them dissipate excess power that is invisible to the eye and inaudible to the ear, and all of them appear immediately in a thermal image.
The practical consequence is that thermography finds the failure mode that most frequently causes unplanned electrical outages in Indonesian plants: progressive connection degradation. These faults develop slowly over months, produce no vibration signature, do not appear in oil samples, and give no warning through normal process instrumentation until the joint fails, flashes over, and takes the feeder or the board down with it.
The economic argument is equally direct. A thermographic survey of a main switchboard takes a fraction of the time that a shutdown inspection would require, needs no isolation, and can be done while the plant runs at full production. The findings are prioritised by temperature rise, so the worst defects are identified and scheduled before they become failures. Infrared thermography analysis is one of the few predictive techniques that delivers an immediately actionable result from a single survey, with no trend data required to interpret it.
Electrical Inspection: Where Thermography Delivers the Most Value
Electrical inspection is the dominant application, and the reason is physics rather than preference. Electrical faults are thermal faults. A connection carrying load with elevated resistance dissipates power as heat, which means the defect is self-announcing provided the circuit is energised and someone points a camera at it.
Switchgear, Busbars, and Cable Terminations
Low-voltage and medium-voltage switchgear is where the highest-consequence thermographic findings occur. Loose busbar joints, deteriorated cable terminations, corroded fuse clips, and degraded contactor tips all present as localised hot spots against a uniform baseline. Because a switchboard contains many similar circuits, comparison between phases and between identical feeders is straightforward, and even a modest temperature difference becomes visible when the reference points are otherwise identical.
Medium-voltage equipment requires additional care. Infrared radiation does not pass through a closed metal enclosure, so inspection relies on IR windows, viewports, or a controlled approach during safe opening. Where IR windows are installed, periodic inspection becomes routine and safe; where they are not, the survey is limited to what is visible and externally accessible, which is a strong argument for specifying windows during the next switchgear upgrade.
Motors, Transformers, and Control Panels
On motors, thermography reveals overloaded operation, voltage imbalance between phases, blocked ventilation, and deteriorating bearings before they produce audible or vibration indications. On transformers, it identifies overheating bushings, poor cooling, and connection problems at the primary and secondary terminations. Control panels show the cumulative effect of every marginal connection inside them, and are among the most productive targets for a routine survey.
Mechanical and Process Applications
While electrical work dominates, mechanical thermography adds genuine diagnostic value in specific applications where thermal behaviour is the primary indicator.

Bearing and lubrication condition. A bearing running with insufficient or degraded lubricant runs hotter than its neighbours under the same load. Thermal comparison between similar bearings on the same machine is a fast screening method that points to the specific bearing warranting closer examination by vibration analysis.
Coupling and alignment problems. Misalignment generates heat at the coupling and in the bearings adjacent to it. A thermal survey of a motor-driven train frequently shows a characteristic thermal gradient that correlates with a vibration finding, providing independent confirmation of the same root cause.
Refractory, insulation, and steam systems. In furnaces, boilers, and high-temperature process equipment, thermography detects refractory degradation, insulation loss, and steam trap failure. A failed steam trap is a direct energy loss, and thermographic identification of failed traps is one of the highest-return applications in any plant with a steam system.
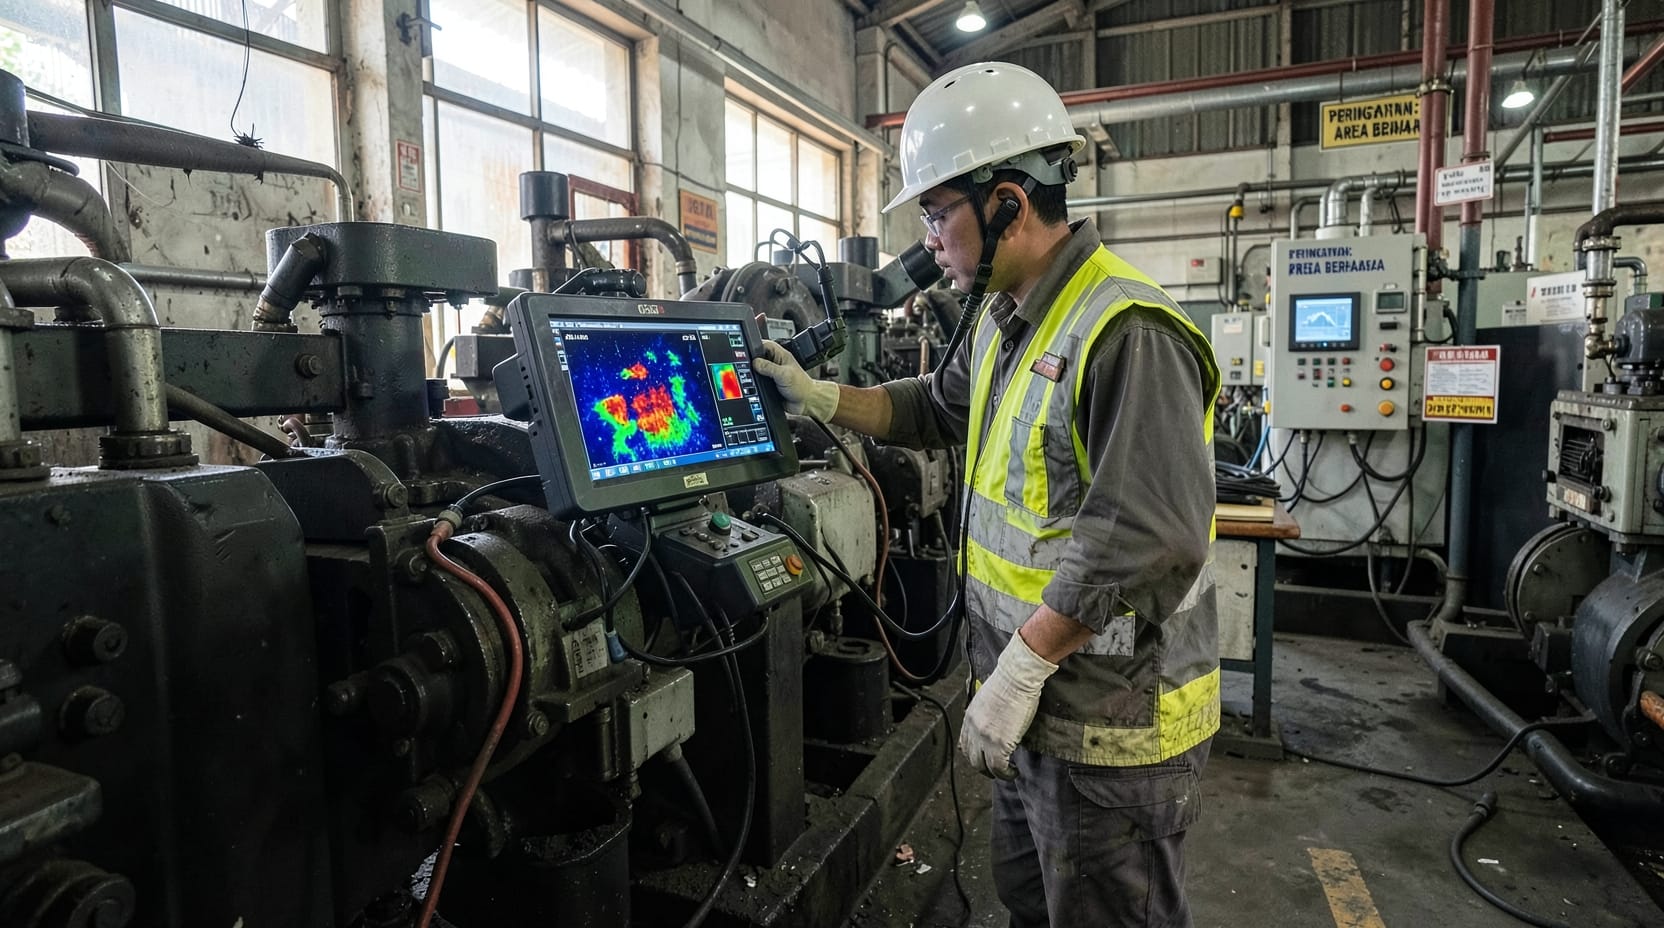
Electrical connections on process equipment. Heating elements, trace heating circuits, and high-current process connections are frequent sources of both energy waste and failure, and are best surveyed while operating.
Conditions That Determine Whether a Survey Is Valid
A thermographic survey conducted under the wrong conditions produces data that is misleading at best. These are the variables that must be controlled.
| Condition | Requirement | What Goes Wrong If Ignored |
|---|---|---|
| Load level | Survey at normal or higher load — ideally above 40 percent of rated current | Low-load circuits produce no meaningful temperature rise, so real defects are missed entirely |
| Emissivity setting | Correct value entered for each surface material | Shiny or reflective surfaces report falsely low temperatures, hiding real hot spots |
| Reflected radiation | Viewing angle and shielding managed for low-emissivity surfaces | Sunload or adjacent hot surfaces reflect into the target and create phantom faults |
| Wind and convection | Outdoor surveys avoided in strong wind or conducted with correction | Forced convection masks genuine temperature rise, understating severity |
| Ambient reference | Ambient and reference temperatures recorded with every measurement | Without a reference, a temperature rise cannot be calculated and severity cannot be judged |
| Baseline and trend | Same routes, same load conditions, historic images retained | Each survey becomes a standalone snapshot, losing the trend that shows deterioration |
Severity assessment is the interpretive step that converts a picture into a maintenance priority. A common and defensible approach compares temperature rise above ambient or above a similar reference component, and classifies findings into bands requiring action at the next opportunity, at the next planned outage, or immediately. The band boundaries matter less than applying them consistently, because consistency is what makes comparison between surveys meaningful.
Safety: The Discipline That Governs Every Survey
Thermography requires access to energised equipment, which is precisely the hazard the technique is designed to help you avoid discovering the hard way. Survey work must be planned with the electrical authority, conducted only by personnel trained for the voltage class and equipment type, and performed with appropriate arc-flash protective equipment where the equipment class demands it.
Working distance matters for two reasons. It keeps the thermographer outside the arc-flash boundary, and it is a genuine measurement variable: at longer distances the apparent temperature of a small target is diluted by surrounding cooler surfaces, so a small hot spot can read lower than it actually is. Understanding this relationship between spot size and distance is what separates a competent survey from a misleading one. Certified thermographers at Category I and II level, as defined by ISO 18436, are trained to manage both the safety envelope and the measurement uncertainty.
Integrating Thermography With the Rest of Your Reliability Program
Thermography’s greatest limitation is that it measures surface temperature only. It cannot tell you which internal bearing element is failing, it cannot measure lubricant chemistry, and it cannot assess mechanical energy. That limitation is not a weakness if the technique is deployed within a program that covers the complementary domains.
The integration logic is straightforward. Thermography screens broadly and cheaply across electrical and thermal domains and identifies where the problem is. Vibration analysis then diagnoses mechanical faults with high spatial resolution. Oil analysis detects wear chemistry and contamination before mechanical symptoms appear. Condition based monitoring is the framework that routes these findings into one asset register and one work-order stream, and equipment criticality ranking decides how frequently each asset is surveyed and how much diagnostic depth it justifies.
Where a plant has already built a predictive maintenance program, adding thermography is usually the fastest available expansion of coverage, because it addresses an entire failure class — electrical — that vibration and oil analysis cannot see. Conversely, a plant that runs only thermography has an excellent electrical program and nothing for its rotating machinery.
How Tiaravib Structures a Thermography Program
Tiaravib provides infrared thermography as a structured survey program rather than a one-off inspection. The work begins with route definition: which boards, panels, motors, and process equipment are surveyed, at what load condition, and on what frequency, based on the equipment criticality ranking. Certified thermographers then conduct the survey to a consistent method, with load and ambient conditions recorded for every measurement so results remain comparable between visits.
The report separates findings from recommendations. Each exception is presented with its thermal image, a visible-light reference image, the measured temperature rise, and a severity classification, followed by a recommended action and time frame. Where a thermal finding points to a mechanical or lubricant problem, the survey triggers the relevant follow-up diagnostic rather than ending at the observation, and where the same equipment appears repeatedly, a bad actor analysis establishes whether the cause is chronic or incidental. Findings are delivered in a format that electrical and maintenance planners can act on directly, so the survey output becomes scheduled work rather than a report that is filed and forgotten.
The U.S. Department of Energy‘s industrial assessment guidance treats infrared inspection as a first-line tool for identifying electrical and steam-system energy losses.
Arc-flash and electrical safe-work requirements governing live inspection are set out by the Occupational Safety and Health Administration in 29 CFR 1910 Subpart S.
Traceability of the temperature measurement itself rests on the calibration framework maintained by the National Institute of Standards and Technology.
Key Takeaways
- Infrared thermography detects abnormal temperature without contact, making it the primary predictive technique for electrical distribution defects.
- Its distinctive advantage is inspecting live equipment under normal load, which is the condition in which electrical faults actually develop and reveal themselves.
- Electrical applications dominate: switchgear, busbars, cable terminations, motors, transformers, and control panels.
- Mechanical applications add value for bearing lubrication, coupling alignment, refractory, insulation, and steam trap failures.
- Survey validity depends on controlled load, correct emissivity, managed reflections, and consistent ambient references — an uncontrolled survey produces misleading data.
- Thermography measures surface temperature only, so it works best integrated with vibration and oil analysis under shared criticality ranking.
Ready to Transform Your Asset Reliability?
Talk to Tiaravib’s certified reliability engineers today — ISO 18436 certified analysts ready to support your plant.
Frequently Asked Questions
Can thermography detect electrical faults without shutting down the equipment?
Yes, and that is its principal advantage. Because thermography measures emitted infrared radiation from a distance, the circuit can remain energised and under normal load during the survey. This is essential rather than convenient: a de-energised circuit carries no current, dissipates no power, and produces no thermal signature, so a joint that is dangerously loose reads as perfectly normal once the power is off. The survey must therefore be conducted live, which is why safe working practice and arc-flash discipline matter so much.
What load conditions are required for a valid thermographic survey?
Survey the equipment at normal operating load, and ideally at 40 percent of rated current or higher. Below that level, a genuinely defective connection may dissipate too little power to produce a detectable temperature rise, and the defect is missed rather than ruled out. Where a circuit cannot be loaded sufficiently during the survey window, record the actual load with the measurement so the finding can be interpreted correctly and re-surveyed under proper conditions.
How do I tell a real hot spot from a reflection?
Reflections occur on low-emissivity, shiny surfaces such as bright metal, and they typically disappear or move when the viewing angle changes. Confirming a finding involves changing the angle, checking the emissivity setting for the material, and where necessary shielding the target from nearby hot surfaces or sunlight. Genuine thermal faults persist across angles and align with the physical component, such as a specific terminal or joint, rather than appearing as an oddly shaped patch.
Does thermography replace vibration analysis on rotating machines?
No, and relying on it alone would leave most rotating-machine failures undetected. Thermography measures surface temperature, so it responds only once a mechanical problem has progressed far enough to generate heat. Vibration analysis detects imbalance, misalignment, bearing defects, and looseness long before they produce a measurable temperature change. The correct arrangement uses thermography for fast broad screening and vibration for diagnosis, with findings integrated rather than treated as competing opinions.
How often should a thermographic survey be conducted?
Annual surveys across the full electrical distribution system are a reasonable baseline for most plants, with the highest-criticality switchgear, main incoming boards, and high-current joints surveyed more frequently — commonly quarterly or semi-annually. Frequency should also respond to findings: equipment that has produced exceptions in consecutive surveys, or that appears repeatedly in failure records, warrants tighter intervals and a bad actor analysis rather than a nominal annual visit.
What qualifications should a thermography provider hold?
Thermographers should be certified under a recognised scheme, with ISO 18436 Category I suitable for routine electrical and mechanical surveys and Category II for more complex applications and severity classification. Beyond certification, the provider should supply a defined route plan, record load and ambient conditions with every measurement, retain images for trending, and deliver findings with clear severity bands and recommended actions. A provider who returns images without interpretation is not delivering a reliability service.
For a site assessment or pilot proposal, contact Tiaravib via WhatsApp +62 821-1378-3727 or info@tiaravib.com.