Advanced Vibration Analysis Diagnostics Indonesia: Bearing, Gearbox, and Resonance Detection
Direct answer (AEO): Advanced vibration analysis moves beyond overall level and basic spectrum to identify specific faults — rolling-element bearing defects, gearbox faults, resonance, misalignment, imbalance, and looseness — through specialized techniques including envelope (demodulated) analysis, spectrum analysis, phase analysis, time waveform, and operating deflection shape (ODS) evaluation. For Indonesian plants, mastering these advanced diagnostics is what converts a vibration program from “we measure” to “we diagnose and prevent”. This article explains the key advanced techniques, how to recognize the characteristic fault signatures for bearings, gears, and resonance, and the certification and equipment needed to run these diagnostics credibly in Indonesian operating conditions.
Need a reliability partner in Indonesia? Contact Tiaravib — email info@tiaravib.com or WhatsApp +62 850-0167-7742.
Envelope (Demodulated) Analysis: Finding Bearing Faults at the Incipient Stage
Envelope analysis, also called demodulated spectrum or high-frequency envelope detection, is the most powerful technique in an advanced vibration analyst’s toolbox for rolling-element bearings. The idea is elegant and practical. Incipient bearing defects like spalls, pits, and cracks produce short, impulsive impacts as the rollers pass over the damaged surface; these impacts excite high-frequency resonances in the bearing and housing and repeat at characteristic frequencies that depend on the bearing geometry and shaft speed — the ball pass outer race (BPFO), ball pass inner race (BPFR/BPFO-inner, properly BPFO for outer and BPFI for inner), fundamental train, and ball spin frequencies.
The problem with simply looking at a standard spectrum is that the tiny impulses sit at high frequency where the amplitude is low and easily hidden by noise. Envelope analysis solves this by filtering to a high-frequency band, demodulating (extracting) the impulsive envelope, and then performing an FFT on that envelope. The result is a spectrum that makes the bearing defect frequencies pop out with clear sidebands, even when the overall vibration is still moderate. This is the technique that catches an outer-race spall weeks before a standard overall-velocity reading would classify the machine into Zone C or D.
Using envelope analysis correctly requires the right setup and interpretation in Indonesian operating conditions. The high-pass filter band must be chosen to capture the machine’s bearing resonances, which vary, and the analyst must separate genuine bearing defect frequencies from harmonics of rotational and gear mesh energy that happen to coincide. Baseline the bearing’s own signature when new, because each machine family and load has a distinct normal. The certified analyst’s skill in setting the band and reading the result is precisely the competence that ISO 18436 Category II and III certification validates, and it is the difference between preventing a spall and discovering it after catastrophic failure.
Spectrum and Phase Analysis: Separating Imbalance, Misalignment, and Looseness
Fundamental spectrum analysis identifies the classic fault signatures. Imbalance shows as a dominant 1× rotational frequency peak in the radial direction, typically constant in magnitude and highest on the horizontal plane, and its amplitude rises with the square of speed. Misalignment shows a strong 2× rotational peak, often with harmonics and a characteristic axial content, and tends to have a stable relationship to the rotational speed. Mechanical looseness produces a distinctive pattern of many harmonics of the rotational speed — a “haystack” of energy across the spectrum with a large number of 1× harmonics and sometimes a sub-harmonic at 0.5×. Identifying which signature dominates is the first diagnostic step.
Phase analysis adds the directional and timing information that a pure amplitude spectrum cannot provide. By measuring the vibration at multiple points with a phase reference (a keyphasor or tachometer pulse), the analyst determines whether two ends of a coupling move in phase (suggesting imbalance about a node) or out of phase (suggesting misalignment or a soft foot). Phase at 1× versus 2× differentiates rotor-related from alignment-related problems, and phase across the axial measurement distinguishes thrust and angular misalignment. For a large mill drive or turbine train, phase analysis is what separates a diagnosis you can act on from a guess.
The signal-processing foundation matters as much as the analysis. Valid diagnostic frequency calculations require knowing the rotational speed precisely — a common error is assuming nameplate speed when the machine actually runs at a different speed under load, which misplaces every harmonic and characteristic frequency in the diagnosis. In Indonesian plants running at reduced or varying load, capture the actual speed with a tachometer or keyphasor alongside the vibration. The fundamentals behind these signatures are detailed across our vibration analysis Indonesia knowledge base.
Time Waveform and Shock Pulse: Reading Faults the Spectrum Hides
The time waveform is the raw vibration signal before the FFT, and it reveals fault features that spectra average away. Impacting from a cracked or spalled bearing shows as a periodic series of spikes in the waveform, spaced at the bearing defect period, with a shape that a spectrum cannot easily distinguish from random noise. Gear faults show as local amplitude modulations and rising of the gear mesh and sidebands. Looseness produces a truncated or asymmetric waveform characteristic of the part banging between clearances. Skilled analysts use the time waveform to confirm what the spectrum suggests and to catch faults too transient or nonstationary for a clean FFT.
Shock pulse technology instruments the high-frequency impact energy from bearing and gear defects directly, typically expressed in decibels, and is a fast field screening tool. It is especially valuable for the long tail of machines where a full spectrum analysis is not economical — an operator with a shock pulse meter can screen dozens of bearings quickly and flag the ones needing a full diagnostic review. The tool complements, not replaces, the spectral and envelope analysis, and it suits the route-based model that most Indonesian plants run for their non-critical fleet.
Where the spectrum and time waveform both look ambiguous, real-time analysis with high-resolution zoom bands and cepstrum analysis can extract periodicities in log-frequency space — useful for identifying harmonics and families of gear and bearing tones that are hard to see otherwise. The modern analyst combines these tools iteratively rather than relying on any single one, and the certification framework in our Tiara Competency Center programs is built on exactly this toolset.
Resonance Detection and Operating Deflection Shape (ODS)
Resonance is a hidden killer: when a machine’s excitation frequency coincides with a structural natural frequency, vibration amplifies dramatically even if the forcing is small. A resonance often shows as a very strong response at a frequency that is integer-related to the running speed or its harmonics — for example, a persistent high 1× response that does not behave like classic imbalance may actually be a structural resonance at running speed. The definitive test is a run-up/coast-down test that sweeps the running speed and reveals self-excitation peaks, or a bump test that excites the structure’s natural frequencies directly.
Operating Deflection Shape (ODS) animation visualizes how the machine and its support structure actually deform during operation, using time-synchronized measurements across multiple points. ODS makes resonance, soft foot, and flexible support problems visible as motion of the structure, which amplitude data cannot convey. It is the tool for chronic high-vibration problems that resist conventional correction — a compressor that stays high on every visit, a fan with a resonance in its base frame, a pump whose discharge pipe vibrates violently. Bolting a sensor to the machine measures the symptom; ODS reveals the structure that is feeding the amplification.
Interpreting resonance requires care with the Indonesian reality of wide speed ranges and process variability. A machine that resonates at one speed may be perfectly quiet at another, so the run-up/coast-down and the operating speed envelope must reflect the actual duty cycle. Correcting a resonance usually means adding or moving stiffness or damping to shift the natural frequency away from the excitation, which is a structural solution rather than a bearing replacement — the reason resonance problems persist through repeated overhauls is that a new bearing does not fix a resonance at all. The approach for chronic high-vibration machines is covered in our vibration analysis complete guide.
Advanced Diagnostics for Gearboxes and Complex Trains
Gearbox fault detection is among the most demanding advanced diagnostic applications because the signal is dense with gear mesh frequencies, sidebands, and harmonics that drown the fault indicators. The first step is to establish the gear mesh frequency from the actual tooth count and shaft speeds, then examine the sidebands around the mesh frequency for amplitude modulation characteristic of a worn or cracked tooth. A localized tooth fault produces a strong impulse once per revolution with energy at many harmonics, visible in both the spectrum and the time waveform, and progressive wear shows as a general rise in the gear mesh amplitude and its sideband structure.
For complex multi-stage gearboxes, the analyst must separate the contributions of each stage, which requires accurate shaft speed identification at each mesh. This is where the same principles as bearing envelope analysis apply — demodulate around each gear mesh frequency to isolate the fault-modulated sidebands from the broad background. A cracked tooth on a mill gearbox caught through sideband monitoring is, in Indonesian mining and cement operations, the difference between a scheduled gear change and a catastrophic shredding of the gear case that stops production for weeks.
Bearings within a gearbox, and for the motor and driven machine bearings, follow the envelope and spectral analysis described above, but hidden inside gear rattling their fault frequencies need the high-frequency demodulation to surface. The integration of gearbox mesh analysis, bearing envelope, and phase analysis for a whole train is the mark of a Category III level analyst, and it is exactly the depth that dedicated failure-mode studies in our bearing failure analysis and gearbox condition monitoring resources cover in detail.
Bringing It Together: An Advanced Diagnostic Decision Workflow
The professional workflow starts with a trigger — an overall level crossing, a rising trend, an envelope alarm, an operator report — and proceeds through confirmation. Step one is capturing a clean, correctly configured dataset: the speed, the load, the mounting, and the time and care needed to acquire a valid waveform. Step two is the pattern analysis: identify the dominant fault signature family (imbalance, misalignment, looseness, bearing, gear, resonance) from the spectrum, envelope, waveform, and phases together. Step three is validation: correlate the diagnosis with the operating context, the maintenance history, and ideally a physical inspection to confirm what the data says before recommending action.
The final step is the recommendation and the loop back to action: issue a documented finding with severity, proposed repair, and priority, schedule it through the CMMS, and verify the machine returns to baseline after the repair so the diagnosis is closed out and the model is validated for next time. This closed-loop discipline is what makes advanced diagnostics worth doing; a diagnosis that does not change the maintenance plan is just measurement. The governance rhythm that sustains the loop is the reliability scorecard in our asset reliability KPI scorecard article.
Advanced Diagnostic Techniques and Their Fault Signatures
| Technique | Best Used For | Key Fault Signature | Typical Indonesian Application |
|---|---|---|---|
| Envelope / demodulated spectrum | Rolling-element bearing faults | BPFO / BPFI / BSF peaks with sidebands | Motors, pumps, mills, crushers |
| Spectrum 1×/2×/harmonics | Imbalance, misalignment, looseness | 1× (imbalance), 2× (misalignment), many harmonics (looseness) | All rotating machines |
| Phase analysis | Differentiating rotor vs alignment fault | In-phase vs out-of-phase at 1×/2× | Large mill and turbine trains |
| Time waveform | Impacting, transient, nonstationary faults | Periodic impact spikes at defect period | Confirming bearing and gear defects |
| Shock pulse | Fast bearing screening on many machines | High dB spike, warning of defect | Route screening of non-critical fleet |
| Run-up/coast-down + ODS | Resonance and structural flexibility | Self-excitation peaks; ODS motion | Chronic high-vibration machines |
| Gear mesh sideband analysis | Gearbox tooth wear and cracks | Mesh frequency sideband amplitude rise | Mill, crusher, conveyor gearboxes |
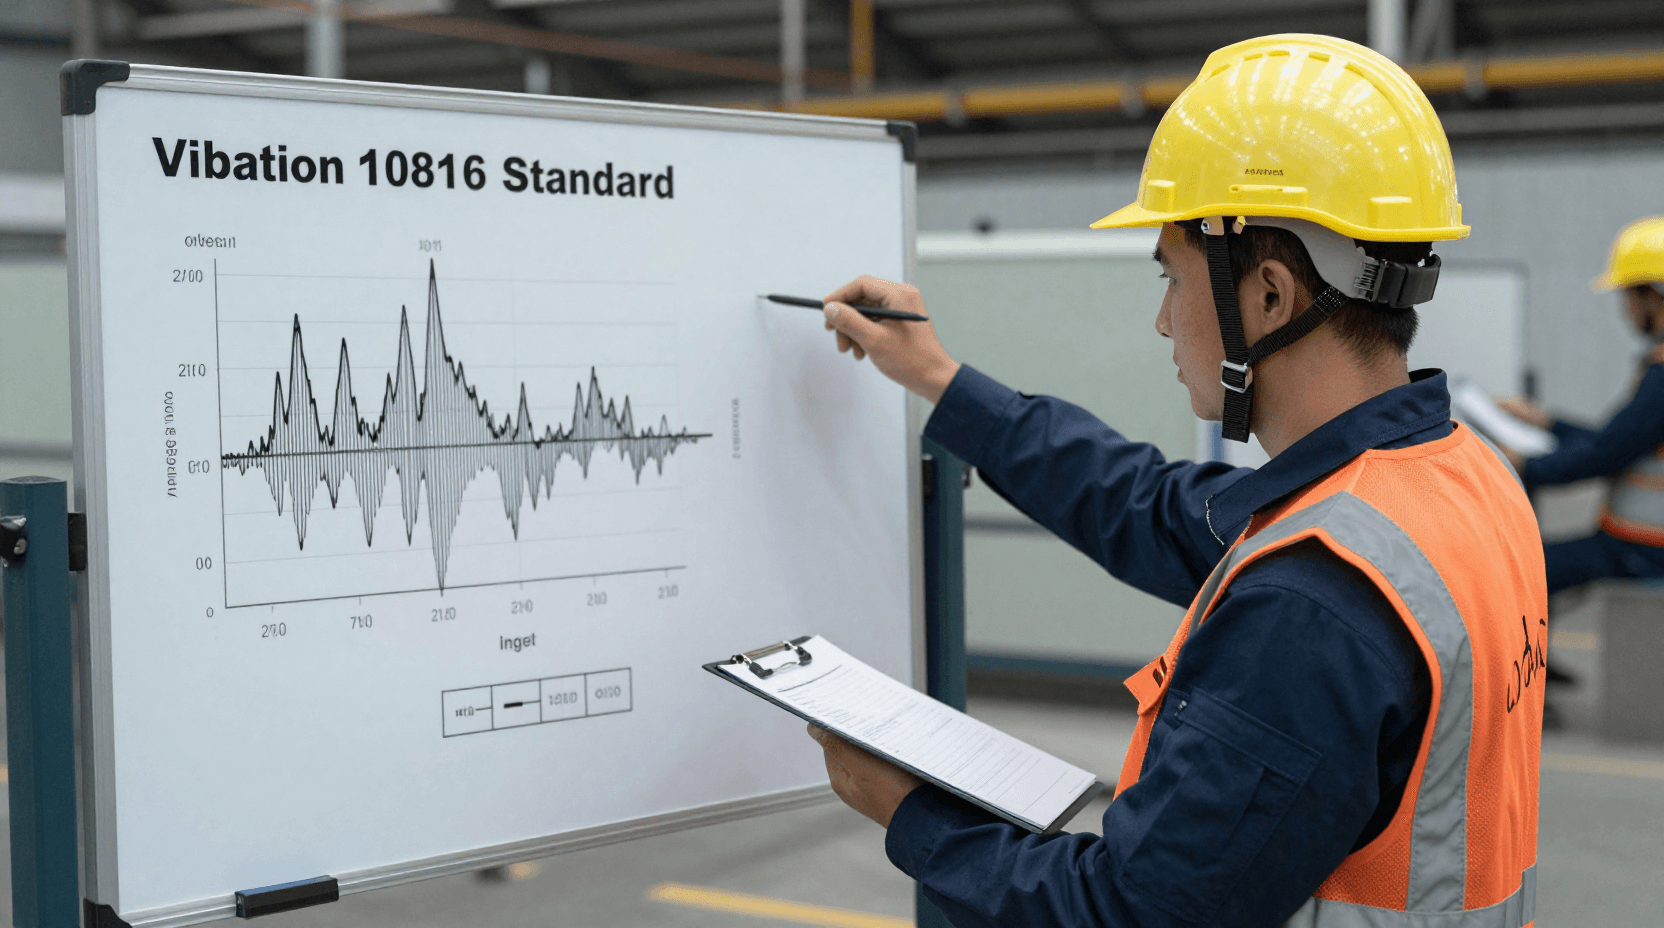
Standards and research referenced: Vibration Institute and ISO 20816 Mechanical Vibration Standard.
Ready to Transform Your Asset Reliability?
Talk to Tiaravib’s certified reliability engineers today — ISO 18436 certified analysts ready to support your plant.
Frequently Asked Questions
What is the difference between basic and advanced vibration analysis?
Basic analysis measures overall vibration levels and simple spectrum peaks to classify machine severity, typically to ISO 10816. Advanced analysis adds techniques — envelope (demodulated) analysis for bearing faults, gear mesh sideband analysis, phase analysis, time waveform, resonance tests, and operating deflection shape — to identify the specific fault and its cause. Basic tells you the machine is in trouble; advanced tells you exactly what is failing and why, which is what enables early intervention and prevention.
How do I detect a bearing fault before it becomes catastrophic?
Use envelope (demodulated or acceleration enveloping) analysis, which filters to the high-frequency band where incipient bearing defects excite resonances, then demodulates to reveal the characteristic defect frequencies (BPFO, BPFI, BSF) with their sidebands. Catch the fault while the overall level is still moderate, schedule a planned replacement, and avoid the catastrophic failure and collateral damage a missed bearing produces. This is the single highest-value advanced technique for Indonesian plants.
Why is my machine still vibrating after a bearing replacement?
Because the bearing may not have been the root cause. Chronic high vibration that persists through overhauls is often structural — a resonance where an excitation frequency coincides with a natural frequency, or a loose/flexible support. A resonance test (run-up/coast-down or bump test) and operating deflection shape (ODS) analysis reveal whether the structure is amplifying the vibration. Fixing the resonance — adding or moving stiffness or damping — is the actual correction, not another bearing swap.
Does our plant need Category III analysts to do advanced diagnostics?
Advanced diagnosis of gearboxes, complex trains, and resonance problems is the domain of ISO 18436 Category II and III certified analysts; Category I operators typically run routes and basic collection under supervision. Indonesian plants that cannot retain that depth on-site commonly pair an in-house operator with a certified partner such as Tiaravib, who provides the advanced diagnostic review of complex cases, failed-gearbox analysis, and resonance studies. Certification and mentoring paths are available through the Tiara Competency Center.
For a site assessment or pilot proposal, contact Tiaravib via WhatsApp +62 850-0167-7742 or info@tiaravib.com.